

Issue:April 2016
NANOPARTICLE CHARACTERIZATION - One Size Does Not Fit All: Nanoparticle Size Analysis for Nanomedicine Applications
ABSTRACT
The use of nanoparticles for drug delivery is receiving increasing attention by researchers in academia, industry, and federal research institutions. Monitoring the size distribution of nanoparticles is an important requirement for process control, for evaluating the efficacy of the drug delivery strategy, and for ascertaining the potential for dangerous, possibly fatal, immunogenic responses in patients treated with nanoparticle-based drugs. Here, we describe a new diagnostic instrument able to rapidly and accurately report detailed nanoparticle size distributions for a wide variety of nanoparticle types and concentrations in a range of different solutions.
INTRODUCTION
Nanoparticle-based drug delivery systems are of great interest to drug developers in industry and academia, primarily because they provide an alternative means for targeting and delivering therapeutic treatments to patients. These systems offer a number of potential advantages, including better stability, reduced side-effects, and the ability to target the delivery of a wide range of drugs and other therapeutics.1 In addition, there has been significant interest in using nanoparticles as vehicles for vaccine delivery.2,3 However, such nanoparticle-based systems can trigger adverse immune responses, driven by such variables as nanoparticle size and the detailed surface properties of the nanoparticles.4 Furthermore, unintended processes, such as aggregation or modification of the surface composition of nanoparticles in a formulation, may interfere with the effectiveness of the delivery or action of the drugs, and possibly cause harm in patients treated with the faulty products.
Unfortunately, instrumentation that can quickly and accurately report the size distribution of nanoparticles, and monitor the evolution of these distributions, has until now been essentially unavailable. This is especially acute for nanoparticles below roughly 1 micron in diameter. Dynamic light scattering (DLS) is a highly popular tool in this area, mostly due to its ease of use and its ability to detect a very wide range of particle sizes. However, DLS is well known to suffer from severe limitations, most prominently stemming from its inability to accurately measure polydisperse solutions: in samples with mixed particle populations, DLS often reports a single peak in a particle distribution when in fact there are a number of distinct groups of particle diameters. Reliable measurements of smooth distributions spread over a few diametric octaves are also highly problematic. Furthermore, DLS is unable to provide any concentration information, even though this is often a critical parameter in monitoring or debugging a nanoparticle production process.
Some of the challenges faced by DLS are being circumvented by emerging light-scattering technologies that track and size individual particles. However, these technologies share with DLS the fundamental challenge that particles with an optical index close to that of the suspension medium scatter much less light than those with a significantly different index. This sensitivity dependence makes some types of particles essentially undetectable, and creates a bias toward “brighter” particles. As a result, light-based particle tracking provides a limited ability to measure a variety of biologically relevant particles with diameters less than 100 to 200 nm, despite the fact that the “sweet spot” for drug delivery applications is thought to be below this size range. Other limitations include a quite restricted range of measurable concentrations, and a requirement that the data analysis software reliably distinguish and accurately track particles, a requirement that is difficult to validate.
CONCENTRATION SPECTRAL DENSITYTM
Spectradyne LLC has recently released a novel nanoparticle characterization instrument, the nCS1, which is capable of measuring the size distribution of nanoparticles with diameters ranging from 30 nm up to a few microns, over a wide range of nanoparticle concentrations, from 107 to 1012 particles/ml. The instrument can report accurate size distributions of a wide variety of nanoparticles in a range of suspension media, and reports the data in absolute nanoparticle concentration units.
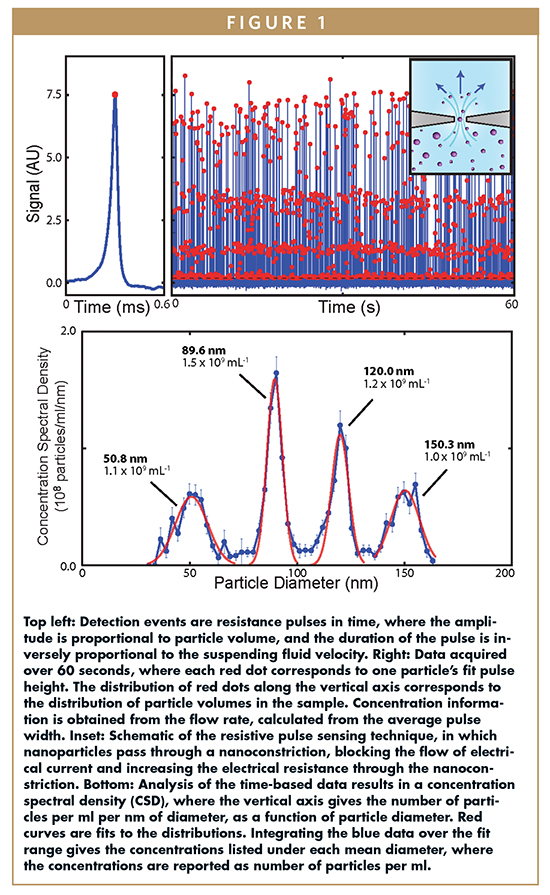
The basis for this new instrument is the well-established resistive pulse sensing technique, implemented by Spectradyne in a miniaturized and disposable microfluidic cartridge. The basic concept involves passing a weakly conducting analyte carrying the nanoparticles or microparticles of interest through a small constriction having a diameter of a few hundred nanometers to a few microns (Figure 1). A bias voltage is applied across the constriction, and the electrical resistance of the current path through the analyte and the constriction is monitored. When a nanoparticle passes through the constriction, it blocks some of the electrical sensing current, increasing the electrical resistance of the constriction by an amount proportional to the nanoparticle volume. Monitoring the electrical resistance as a function of time thus yields a number of short pulses, each corresponding to the passage of one nanoparticle, with the pulse amplitude yielding the nanoparticle volume, and the duration corresponding to the particle dwell time, and thus the particle velocity. As the particles are entrained in the suspending fluid, the pulse duration yields the volumetric flow rate. One can thus obtain the concentration of nanoparticles as a function of nanoparticle size, directly from the time trace of the electrical resistance. For the instrument to work properly, the aqueous solution must have a conductivity that falls roughly in the range of 0.1 to 1 S/m, typically achieved by dissolving 0.01 to 1 M of salt in water. Phosphate-buffered saline (PBS), for example, serves well, and blood serum and urine have the appropriate levels of conductivity.
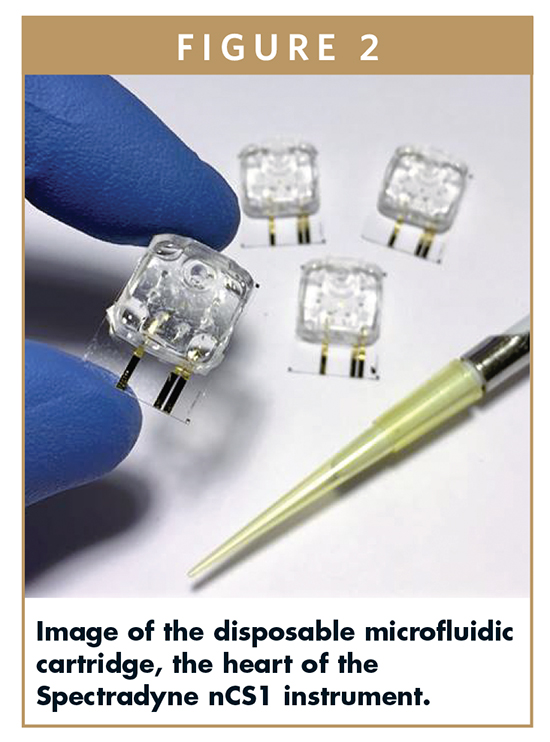
In Spectradyne’s implementation of the resistive pulse sensing technique, particles are detected in a disposable microfluidic cartridge that forms the core of the nCS1 (Figure 2). The sample to be analyzed is pipetted into a reservoir in the cartridge (just 3 microliters of analyte are required), and the cartridge is loaded into the instrument for measurement. The analyte is prevented from contacting any other instrument components prior to analysis, removing any possibility of cross-contamination. After engaging the cartridge with the instrument, automated software controls the microfluidics and data acquisition, and complete data sets can be generated within a minute or so.
Following data acquisition, software-based analysis of the data produces the basic output of the instrument, which comprise particle histograms as a function of particle size. The particle concentration is reported in the form of a concentration spectral density (CSDTM), which corresponds to the number of particles per ml of analyte solution per nm of particle diameter, with an example shown in Figure 1. The absolute concentration of particles in a range of particle diameters can be calculated using a software integration tool, generating size histograms with user-defined diametric bin widths, where the number of particles per ml is provided for each size bin. Examples of similar integrated concentrations are given in Figure 1. The use of the CSD allows inter-comparing measurement results from different samples using different cartridges, as the CSD is independent of the cartridge parameters as well as the widths of the bins used to report particle concentrations.
The resistive pulse sensing technique, which is also known as the Coulter principle5,6 and forms the basis for hematologic whole cell counting, works regardless of whether the nanoparticles are made of an insulating or conducting material: a given diameter polystyrene or colloidal particle will give the same signal as the same diameter gold or other metal particle. This is because electrochemical barriers to electrical conduction through even a good metallic conductor are far too large for the nature of the particle to make a difference.
HIGHLY-ENGINEERED ANALYSIS CARTRIDGES
An image of the disposable analysis cartridge is shown in Figure 2. While containing nanoscale features, the cartridges are produced at low cost using standard molding techniques, allowing the inexpensive reproduction of nanoscale features via casting from a master mold. Using NIST-traceable standard particles, Spectradyne has shown that diametric measurements on nanoparticle samples are reproduced to within 1% to 2%, using different cartridges cast from the same mold. The detailed design of the cartridge, and the methods used for reproducing it from a master mold, follow closely the principles in a recent publication,7 in addition to the accompanying patent.8
The disposable microfluidic cartridge affords a number of powerful advantages over other competing techniques. First and foremost, the maximum sample volume used in an analysis is only 3 microliters, set by the size of the analyte reservoir in the disposable cartridge. This is highly appealing for situations in which the test formulation is expensive or difficult to produce, and provides a significant and welcome reduction in volume from what is needed in, eg, DLS-based analyses. Secondly, the very high count rates afforded by Spectradyne’s instrumentation means that statistically significant data sets can be acquired in just a few tens of seconds of data acquisition. Thirdly, the wide range of concentrations that can be reliably measured, from 107 to 1012 particles/ml, means that many formulations can be measured as is, often without the potentially problematic need for dilution or concentration. Finally, the low cost of the disposable microfluidic technology means that tests can be repeated multiple times without incurring significant expense, allowing the close observation of an on-going process, or monitoring the stability of a formulation following production.
KEY IMPACT AREAS FOR DRUG DEVELOPMENT & DELIVERY
Formulation Analysis
The Spectradyne nCS1 has been used to characterize a wide variety of formulations and biological materials used in the drug delivery industry. High resolution size and concentration distributions for three different examples are shown in Figure 3, including measurements of Doxil, the first FDA-approved nanoparticle-carrier drug formulation; a proprietary polymeric nanoparticle formulation currently in Phase II clinical trials for targeting anticancer drugs to tumors; and a commercial bacteriophage preparation used to evaluate sterilization effectiveness in a cell culture manufacturing process. In each case, the sample was combined with a solution of 150-nm diameter NIST-traceable control beads to provide an in situ positive control, and the mixture was diluted in PBS. The nCS1 has also been used to perform high-resolution measurements on polystyrene beads ranging in size from 50 nm to 1 micron; on gold beads in the 50 to 200 nm range; and on biologically derived exosomes, which typically have a broad distribution in size from a few tens of nanometers up to a few hundred nanometers, sufficiently broad that DLS cannot properly characterize the population distribution.
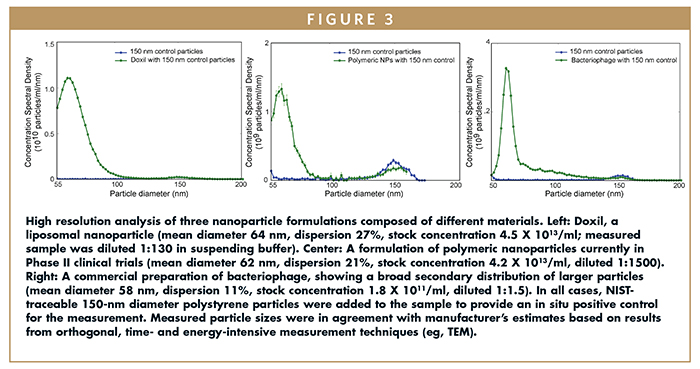
Spectradyne’s nCS1 delivers two fundamentally new metrics that can be used to characterize a nanoparticle formulation more precisely and effectively. First, the instrument reports absolute particle concentration, a parameter that relates to the bioavailability of a drug and directly informs about the production process. Second, the instrument generates high-resolution, statistically significant measurements of particle size distributions, enabling the accurate characterization of size distribution in a particle population and the detection of spurious particles in nearby size ranges.
Stability Testing
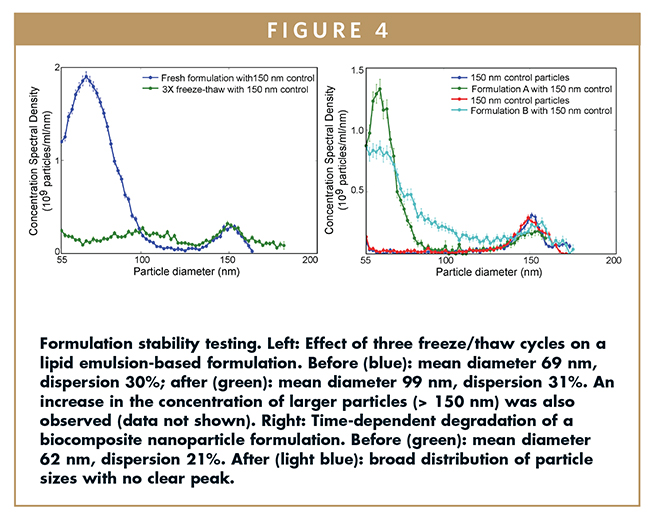
The nCS1’s ability to provide high-resolution size and concentration measurements makes the instrument ideally suited for establishing the stability of formulations under different conditions. In Figure 4, we show two examples of this type of analysis: the direct measurement of the effect of freeze-thaw cycling on a lipid emulsion-based drug product, and the detection of the degradation over time of biocomposite particles in a cancer therapeutic formulation. In both cases, there are clear trends brought out by the detailed representation of the data, with aspects frequently undetectable using other means.
Process Characterization
In addition to the storage and handling conditions previously described, different manufacturing methods and processing parameters may have significant effects on the physical characteristics of a nanoparticle product. A complete understanding of the impact of these variables on the quality of the particles is critical at all stages of development and production.
In Figure 5, for example, we show measurements of a liposomal formulation that was manufactured using two different extrusion pore sizes. Spectradyne’s nCS1 reveals striking details about the samples, where formulation A, fabricated by extrusion through a small pore, contains a relatively monodisperse particle population centered at 74 nm diameter, with a 1-sigma spread of 28% about the peak and a concentration at stock of 2.9 X 10¹⁴/ml. The nCS1 measurement of formulation B, made with a somewhat larger extrusion pore, reveals that there is only a slight change in the peak particle diameter, from 74 nm to 81 nm, and that the concentration of particles in this population falls by roughly a factor of two (to 1.6 X 10¹⁴/ml at stock concentration). The nCS1 further detects a significant increase in the dispersion of particle diameters in formulation B using the larger extrusion pore size, from 28% to 39%.
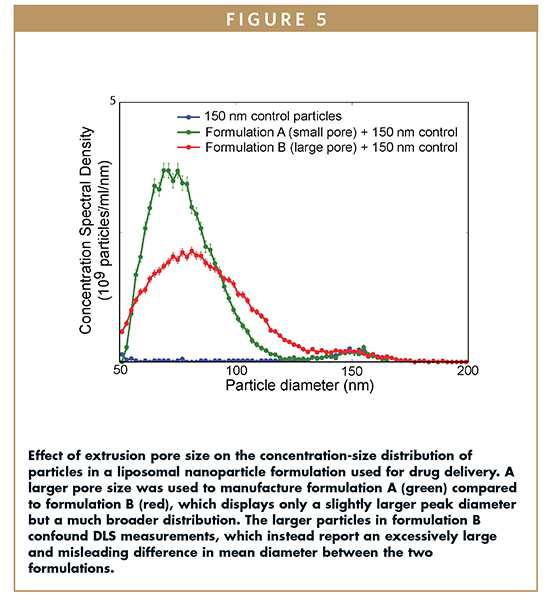
Dynamic light-scattering measurements of these samples, by contrast, report a significant difference in average particle diameter, with 80 nm for formulation A changing to 120 nm for formulation B. The reason DLS makes this rather significant error in the mean particle size for formulation B is that the larger particles at the tail of the distribution scatter light much more strongly than the smaller particles (scattering intensity in DLS scales as diameter to the sixth power). As a result, the small number of large particles in the distribution tail disproportionately dominates the DLS measurement and confounds the result, leading DLS to report a much larger average particle size than is actually present. Note further that DLS does not report the spread in the particle population about these (misleading) average diameters, and of course does not provide the concentration.
The measurements using the nCS1 clearly indicate that the larger pore used in the production process of formulation B compared to formulation A results in an increase in polydispersity. This may critically alter the drug’s overall effectiveness, possibly directly through the change in the particles’ physical characteristics, possible by changing the longevity of the drug in circulation. The clear results generated by the nCS1, with more detailed and more accurate information than those reported by DLS, are thus critical for the manufacturer of this product – Spectradyne’s nCS1 readily provides high-quality information that is unobtainable by standard techniques.
SUMMARY
Spectradyne has developed a powerful new platform for the size and concentration analysis of nanoparticles in a liquid sample. The nCS1 is ideally suited to serve applications in drug delivery and development, including the high-resolution characterization of particle formulations, the detailed analysis of formulation stability, and the quantitative assessment of the effects of process parameters on the quality of the final product. The instrument can measure a wide variety of different materials, and, of great importance to expensive and difficult-to-produce products, generates clear results using an extremely small sample volume of a few microliters.
REFERENCES
1. Zolnik BS, González-Fernández Á, Sadrieh N, Dobrovolskaia MA. Nanoparticles and the immune system. Endocrinol. 2010;151(2):458-465.
2. Gregory AE, Titball R, Williamson D. Vaccine delivery using nanoparticles. Front Cell Infect Microbiol. 2013;3:13.
3. Boraschi D, Italiani P. From antigen delivery system to adjuvanticity: the broad application of nanoparticles in vaccinology. Vacc. 2015;3:930-939.
4. Dobrovolskaia MA, McNeil SE. Immunological properties of engineered nanomaterials. Nature Nanotechnol. 2007;2:469-478.
5. Coulter WH. Means for counting particles suspended in a fluid. US Patent No. 2656508.
6. DeBlois RW, Bean CP. Counting and sizing of submicron particles by the resistive pulse technique. Rev Scient Instrum. 1970;41(7):909-916.
7. Fraikin JL, Teesalu T, McKenney CM, Ruoslahti E, Cleland AN. A high-throughput label-free nanoparticle analyser. Nature Nanotechnol. 2011;6:308-313.
8. Fraikin JL, Cleland AN. High throughput label free nanoparticle detection and size assay. US Patent No. 8,901,914.

Dr. Andrew N. Cleland is the John A. MacLean Sr. Professor for Molecular Engineering Innovation and Enterprise at the University of Chicago, Faculty Director of the Pritzker Nanofabrication Facility, and recipient of Science magazine’s 2010 Breakthrough of the Year. A leading authority on nanotechnology, Dr. Cleland is active in design and process development as Scientific and Technical Advisor at Spectradyne.

Dr. Jean-Luc Fraikin executed the initial development of Spectradyne’s instrumentation as part of his PhD work in Dr. Cleland’s group at UCSB. He has expertise in cancer cell biology, biochemistry, and in the application of microfluidics-based platforms to molecular diagnostics. As Chief Scientist at Spectradyne, Dr. Fraikin leads the development of instrument fluidics, software, and overall system integration.

Dr. Peter Meinhold earned his PhD in Physics from UC Berkeley and, as an experimental astrophysicist at UCSB, is an expert in low noise electronics and signal analysis.He has expertise developing compact instrumentation for space, where measurement failures cannot be tolerated, and in extracting cosmological signals with amplitudes orders of magnitude below instrument noise. As Chief Engineer at Spectradyne, Dr. Meinhold leads development of instrument electronics.

Dr. Franklin Monzon, prior to cofounding Spectradyne with Drs. Cleland, Fraikin, and Meinhold, spent 14 years in the semiconductor industry in various operations and product development roles. He has broad expertise in manufacturing and process development and earned his PhD from Caltech and his MBA from UCLA Anderson. Dr. Monzon leads operations, sales, and business development efforts at Spectradyne and is active in the production of the microfluidic cartridge.
Total Page Views: 3523