


The Last Mile of Digital Implementation: A Technical Framework for Turning Clinical Technology Adoption Into Measurable Value
By Dr. Harsh Shah
As drug development becomes increasingly digitally enabled, the central technology question is changing. For years, much of the industry’s attention focused on whether a platform could be implemented, validated, integrated, and made available to users. Those remain necessary, but they are no longer sufficient.
A system can go live on schedule, pass technical validation, and still fail to create meaningful operational value if it is poorly integrated into site workflows, inconsistently adopted, burdensome to participants, or unable to generate information that improves decision-making.
The U.S. Food and Drug Administration (FDA) has issued guidance addressing digital health technologies for remote data acquisition, decentralized clinical trial elements, and electronic systems and records. ICH E6(R3) similarly places greater emphasis on quality by design, proportionate risk management, and technology-enabled trial conduct.
The next maturity step is value realization: determining whether a technology is used in the intended workflow, produces reliable data, reduces avoidable friction, and contributes to better trial execution or decision-making.
This article proposes a five-layer framework for evaluating that “last mile” of clinical technology implementation and connecting technical deployment to measurable operational outcomes.
GO-LIVE IS A MILESTONE, NOT AN OUTCOME
Implementation programs naturally gravitate toward measurable delivery milestones: configuration completed, validation passed, interfaces tested, sites activated, users trained, and production launched. These measures establish technical readiness, but not whether the technology is delivering its intended value.
Consider an electronic clinical outcome assessment (eCOA) platform. A sponsor may deploy the technology to 100% of planned sites yet still experience high participant support needs, late entries, missing data, or parallel paper workarounds. Similarly, an analytics platform may attract regular users while producing alerts that are frequently ignored because they are not timely, interpretable, actionable, or connected to a defined decision pathway.
The common problem is that measurement stops too early.
A more useful approach defines technology value as a chain of dependent conditions:
Realized Value = Technical Fitness × Workflow Fit × Adoption × Data Reliability × Outcome Conversion
This is a diagnostic model, not a literal financial equation. If one layer is weak, value across the remaining layers may be reduced. A technically excellent system that is not meaningfully adopted has limited value. High adoption of a poorly designed workflow may simply digitize inefficiency. Reliable data that do not reach the appropriate decision-maker at the appropriate time may improve availability without improving trial execution.
THE FIVE-LAYER VALUE REALIZATION MODEL
The proposed framework evaluates clinical technology across five interconnected layers: technical fitness, workflow integration, adoption and utilization, data reliability and operational quality, and outcome conversion.
Figure 1 illustrates how these layers build upon one another and why weakness at any stage can constrain the value ultimately realized from a technology investment.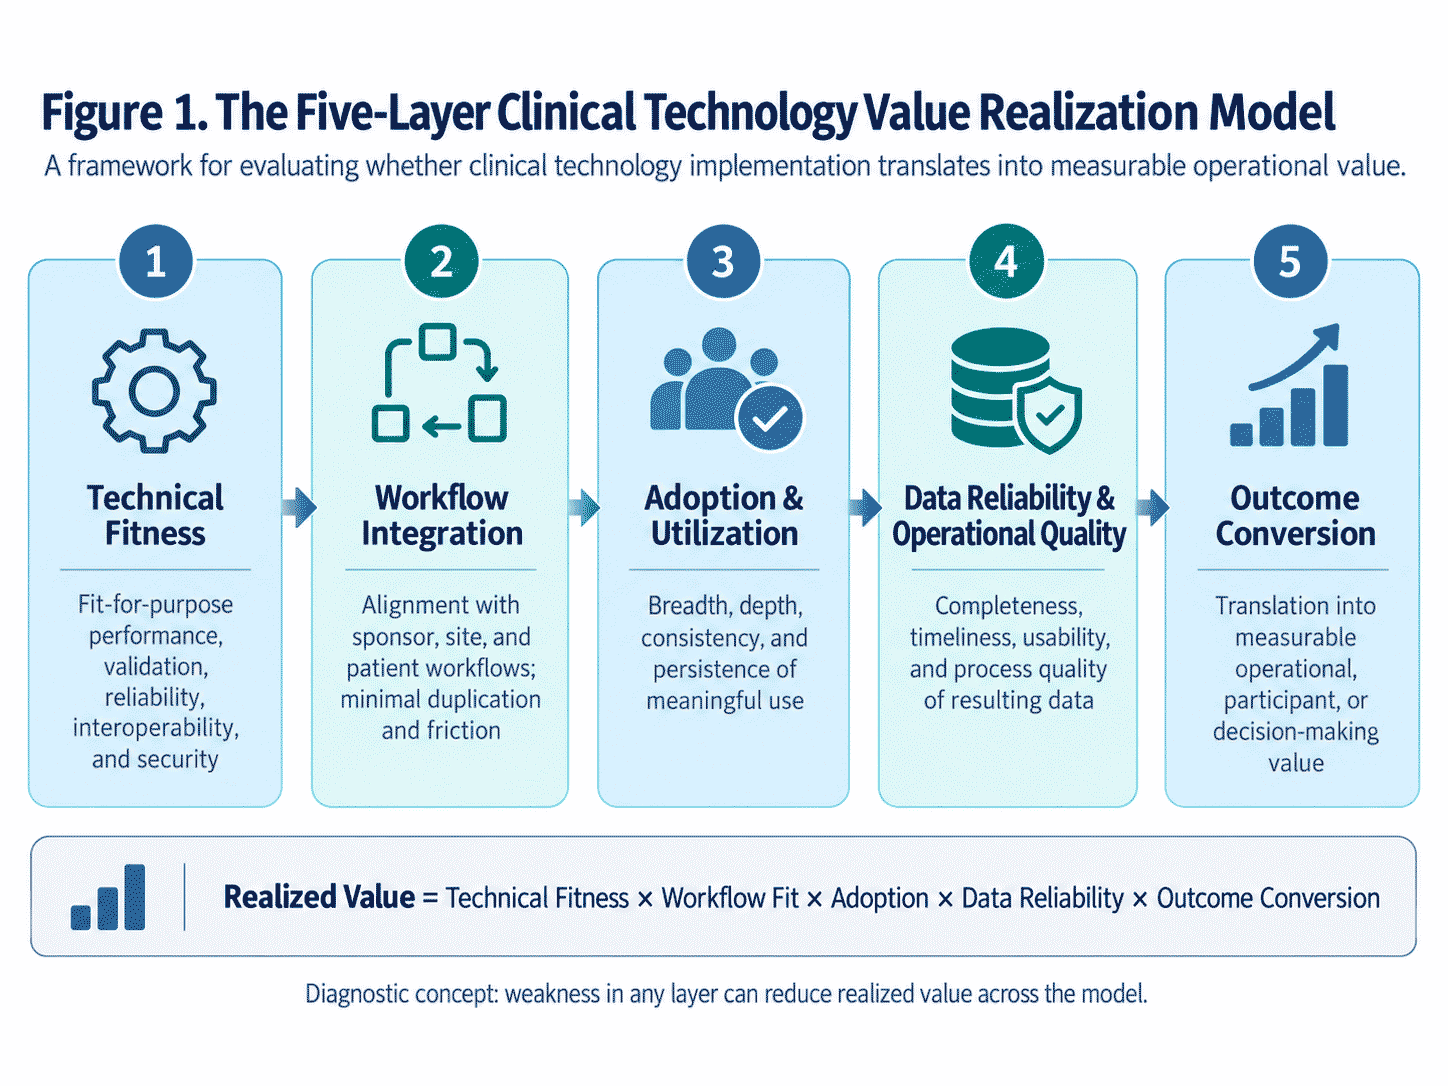
Layer 1: Technical Fitness
The first question is whether the technology is fit for its intended purpose. This includes validation, reliability, security, data integrity, traceability, interoperability, and performance under the conditions in which the trial will actually operate.
For digital health technologies, technical fitness also requires clarity around the clinical concept of interest, measurement characteristics, usability, device performance, data transfer, and the context in which the technology will be used. For electronic systems, auditability, controlled access, reliable records, and appropriate documentation remain foundational.
Technical fitness can be measured using indicators such as system availability, interface failure rates, transmission latency, validation exceptions, device failures, audit-trail issues, and unresolved critical defects. A launch date should never be treated as a substitute for this evidence.
Layer 2: Workflow Integration
The second layer asks whether the technology fits the actual work of sponsors, sites, patients, and partners. This is where many technically successful implementations begin to lose value.
Digital tools are frequently introduced into environments that already contain multiple systems, standard operating procedures, manual checks, handoffs, and role-specific responsibilities. If a new platform adds duplicate data entry, additional authentication, repeated reconciliation, extra training, or unclear ownership, it may simply shift work rather than remove it.
Workflow integration should therefore be assessed by mapping the process before and after implementation. Useful measures include the number of handoffs, duplicate data-entry steps, average task time, support contacts, manual workarounds, escalation frequency, time to proficiency, and user-reported burden. These indicators show whether technology simplifies the process or merely relocates complexity.
Layer 3: Adoption & Utilization
Adoption is more than account activation or training completion. Training completion does not prove proficiency, and frequent logins do not prove that valuable functions are being used.
Meaningful adoption should distinguish four dimensions: breadth, depth, consistency, and persistence.
Breadth asks how many intended users or sites are using the system. Depth asks whether they are using the specific functions linked to the intended value. Consistency evaluates whether use occurs at the required frequency and within the expected workflow. Persistence determines whether adoption continues after implementation support and launch activities decline.
For site-facing technologies, variation between sites can be particularly informative. A strong average adoption rate can conceal a subset of sites experiencing difficulty, creating localized risk to data quality, operational efficiency, or participant experience.
Layer 4: Data Reliability & Operational Quality
The fourth layer evaluates whether use of the technology produces data and processes that are sufficiently dependable to support the trial.
Relevant measures may include data completeness, timeliness, missingness, query rates, reconciliation effort, error rates, protocol deviations associated with the technology, time from data generation to review, and the proportion of data that can be used without manual correction. For digitally derived measures, verification and validation must also be considered in the context of the intended measure and population.
This layer is particularly important because more data do not automatically translate into better evidence. A technology may increase the frequency of data collection while simultaneously increasing missingness, noise, site burden, or reconciliation complexity.
The objective should therefore be fit-for-purpose evidence rather than maximum data volume.
Layer 5: Outcome Conversion
Only after the first four layers are functioning should organizations evaluate whether technology is influencing the outcomes that justified the investment.
Those outcomes will differ by use case. They may include shorter cycle times, fewer manual review steps, faster issue identification, reduced participant travel burden, lower monitoring effort, improved data availability, better retention, faster decision-making, or avoidance of unnecessary work.
For an analytics application, value might be measured through decision latency and the proportion of surfaced signals that result in an appropriate action. For a participant-facing technology, value may be reflected in completion, retention, reduced burden, and the quality of the resulting data.
Causality should be interpreted carefully. Clinical trials are complex systems, and changes in cycle time, data quality, participant retention, or operational efficiency rarely have a single cause. Measurement should determine whether the expected mechanism of value is visible and whether alternative factors plausibly explain the result.
TABLE 1. A PRACTICAL VALUE-REALIZATION SCORECARD
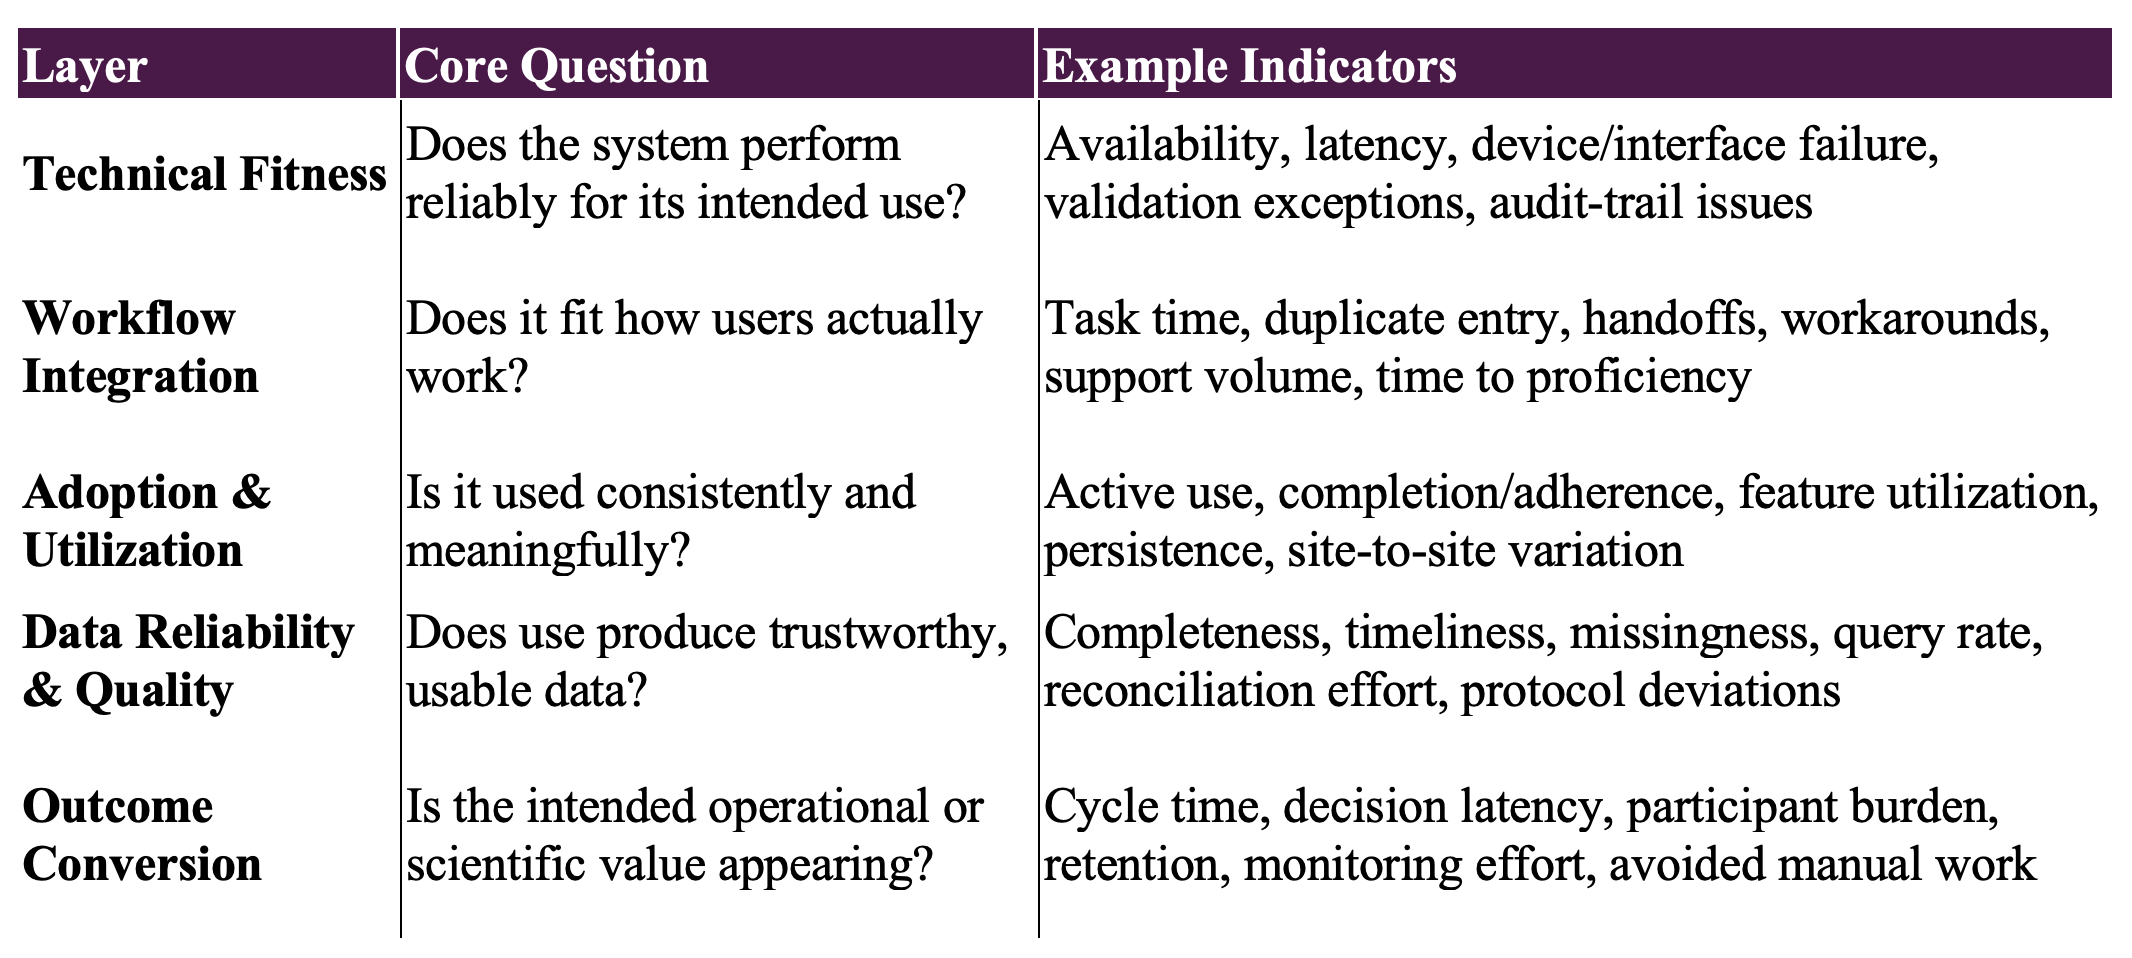
Together, Figure 1 and Table 1 provide two complementary views of the model. The figure describes the progression from technical capability to realized value, while the scorecard translates each layer into questions that can be measured operationally.
MEASUREMENT SHOULD BEGIN BEFORE IMPLEMENTATION
A common weakness in post-implementation assessment is the absence of a baseline. Once technology is live, teams may know current performance but lack a credible comparison with the process it replaced.
Each implementation should therefore begin with a value hypothesis. A value hypothesis specifies the problem being solved, the mechanism through which the technology is expected to help, the population or workflow affected, and the measures that would indicate success or unintended harm.
For example, “introduce electronic consent” is an implementation objective. A more useful value hypothesis would be:
“Electronic consent will reduce administrative delay and improve participant convenience without increasing comprehension risk, site support burden, or exclusion related to technology access.”
That statement implies a more meaningful measurement set: completion time, abandonment, helpdesk contacts, re-consent effort, participant comprehension, connectivity barriers, and site workload.
The same principle applies to artificial intelligence. “Deploy an AI-enabled monitoring tool” provides little information about the value the organization expects to create.
A stronger value hypothesis would define the decision the model is intended to support, what information it should surface earlier than the existing process, who must act on that information, and what level of false-positive or review burden is acceptable.
BURDEN & EQUITY SHOULD BE TREATED AS COUNTERMETRICS
Technology can reduce one form of burden while creating another.
A remote assessment may eliminate participant travel but require the participant to manage a device, troubleshoot connectivity, remember charging schedules, or complete more frequent tasks. A centralized platform may simplify sponsor oversight while increasing work at the investigative site. Automation may accelerate review while increasing the number of exceptions requiring human investigation.
For that reason, benefit metrics should be paired with countermetrics.
If the intended benefit is faster data collection, measure participant and site burden. If the intended benefit is increased remote participation, measure technical support requirements, dropout, and access barriers. If the intended benefit is automation, measure manual review and exception handling.
Countermetrics make unintended consequences visible.
Digital and decentralized approaches may expand participation by reducing geographic barriers, yet aggregate adoption data can conceal differences associated with language, age, connectivity, geography, disability, socioeconomic circumstances, or site capability.
When a technology is intended to broaden participation, utilization and dropout should therefore be examined across relevant populations rather than only in aggregate. A technology should not be considered fully successful if it increases convenience for already well-served participants while creating new barriers for others.
FROM TECHNOLOGY TELEMETRY TO DECISION TELEMETRY
Many organizations already collect system telemetry: uptime, logins, sessions, completion rates, and error logs. The next step is to connect technology telemetry with process and decision telemetry.
Decision telemetry asks what happened because the information existed.
Was an issue identified earlier? Did a monitor intervene sooner? Was a participant contacted? Was a site retrained? Did a study team avoid a manual reconciliation step? Did a development team make a faster or better-supported decision?
This linkage becomes particularly important as artificial intelligence is increasingly incorporated into drug-development workflows.
Model performance alone is not the same as operational value. A technically accurate model can create little practical benefit if its outputs arrive too late, are difficult to interpret, or are not connected to a governed human decision process.
Conversely, modest automation may create significant value if it removes repetitive work from a high-volume process.
The appropriate unit of analysis is therefore not simply:
“Was the tool used?”
A more meaningful question is:
“Did use of the tool change the intended workflow or decision in a measurable and acceptable way?”
This distinction moves technology evaluation beyond activity measures and toward evidence of operational effect.
A POST-IMPLEMENTATION OPERATING MODEL
Value realization should be governed as a lifecycle activity rather than a one-time benefits review.
At minimum, four practices are needed.
First, organizations should establish baseline performance and define success measures before deployment.
Second, the workflow should be instrumented so that adoption, data quality, burden, and operational outcomes can be observed without relying entirely on anecdotal feedback.
Third, accountability should be assigned across the value chain. Technical teams may own system reliability, while clinical operations, data management, sites, and business owners may be responsible for downstream outcomes.
Fourth, organizations should establish periodic value reviews that can lead to process changes, retraining, configuration changes, integration work, or retirement of low-value functionality.
Low adoption may reflect poor usability, but it may also result from a redundant process, insufficient training, misaligned incentives, unclear ownership, or a feature that does not solve an important problem.
The five-layer framework shown in Figure 1 helps locate the constraint rather than defaulting immediately to additional training, additional functionality, or another technology investment.
Importantly, this creates a feedback loop. Technical and operational data collected after implementation can inform future technology selection, protocol design, implementation planning, and investment decisions. Organizations can begin to build evidence not only about whether an individual platform works, but also about the conditions under which technology produces value across studies and populations.
That institutional learning may ultimately be more important than the performance of any single deployment.
CONCLUSION: THE LAST MILE IS WHERE VALUE IS PROVEN
Clinical development does not suffer from a shortage of technology. The harder challenge is converting technical capability into reliable, scalable, human-centered operational performance.
The industry has matured from asking whether clinical trials can be digitized to asking how digital tools should be selected, validated, governed, and integrated.
The next question is whether organizations can measure what happens after implementation with the same rigor used to justify the technology investment in the first place.
A go-live date proves that a system was deployed. It does not prove that workflows improved, data became more reliable, participants experienced less burden, or decisions became better.
The last mile of life sciences innovation is therefore not deployment. It is the measurable conversion of technology into better execution and better evidence.
Organizations that build that measurement discipline into implementation—not after it—will be better positioned to distinguish digital activity from digital value.
REFERENCES
- U.S. Food and Drug Administration. Digital Health Technologies for Remote Data Acquisition in Clinical Investigations. Final Guidance. December 2023.
- U.S. Food and Drug Administration. Conducting Clinical Trials With Decentralized Elements. Final Guidance. September 2024.
- U.S. Food and Drug Administration. Electronic Systems, Electronic Records, and Electronic Signatures in Clinical Investigations: Questions and Answers. Final Guidance. October 2024.
- U.S. Food and Drug Administration. E6(R3) Good Clinical Practice. Final Guidance. September 2025.
- Clinical Trials Transformation Initiative. Digital Health Trials: Recommendations and Resources for Fit-for-Purpose Digital Clinical Trials.
- Izmailova ES, Middleton D, Yunis R, et al. Implementing sensor-based digital health technologies in clinical trials: Key considerations from the eCOA Consortium. Clinical and Translational Science. 2024;17(11):e70054. doi:10.1111/cts.70054.
- Durán CO, Bonam M, Björk E, et al. Implementation of digital health technology in clinical trials: the 6R framework. Nature Medicine. 2023;29:2693-2697. doi:10.1038/s41591-023-02489-z.
- Inan OT, Tenaerts P, Prindiville SA, et al. Digitizing clinical trials. npj Digital Medicine. 2020;3:101. doi:10.1038/s41746-020-0302-y.
- U.S. Food and Drug Administration. Key Considerations for the Development and Use of Digitally Derived Measures for Clinical Investigations. 2026.
Total Page Views: 5