
Issue:January/February 2015
THE SECOND QUADRANT - Outsourcing Solubilization: Making Bioavailability More Broadly Available
In 2014, The Second Quadrant examined how the solubilization market has evolved from the perspective of growth in the number of approved drugs utilizing solubilizing technologies and the diffusion of knowledge and innovation. In this 1st column of 2015, we explore how the contract services and manufacturing market has responded to the opportunity presented by the rising numbers of BCS Type II/IV clinical compounds and solubilized commercial products.
INNOVATION-BY-OUTSOURCING: IMPACT ON SOLUBILIZATION SERVICES
In 2008, research utilizing data from the Business Dynamics Statistics of the US Census Bureau challenged conventional wisdom relating to job creation and small companies. This relatively recent research revealed that new and young businesses – not just small ones – are the primary source of job growth that fuels the economy. Even more pertinent to our discussion, a recent report from The Brookings Institution noted that the drugs and pharmaceutical sector of the US economy is differentiated by a steadily increasing rate of new firm formation and net job growth for startups. Impressively, 44 new pharmaceutical-sector companies were created in 2011, representing a gain of 53% when compared with 1990. These results are even more striking when compared with the total US private sector that experienced a decline of 15% during this same period.1
Notably, the Brookings report attributes the “innovation-byoutsourcing” model of research and development as a contributing factor to job growth and new company formation. It’s widely known that the pharmaceutical industry’s reliance on service providers for research, development and manufacturing services in has been on a growth trajectory for many years. According to a 2013 report by Frost & Sullivan and as published in Drug Development & Delivery last April, the worldwide spend on contract manufacturing services in 2013 totaled $13.43 billion and is forecast to reach $18.49 billion by 2017.2
INSOLUBLE MOLECULES DRIVE MARKET DYNAMICS
The shift to promising and permeable but poorly soluble drugs – estimated to account for between 2,300 and 3,200 molecules in development worldwide3 – has created an opportunity for service providers specializing in solubilization formulation development and manufacturing. The growing demand for services requiring a high degree of specialization is a recognized driver for a fragmented market, one in which numerous players offer critical and varied solutions to meet an expanding opportunity.4 This type of market environment also fosters innovation, as older technologies are applied and new technologies and technological combinations emerge to keep up with the evolving market demand. The relative “newness” of the increasing number of insoluble molecules can also be seen to have catalyzed a marketplace where the frequently more agile small and medium players react quickly to offer services in high demand.5 In addition, this market climate lends itself to divestitures, consolidations and acquisitions, as the market sorts out synergies and individual players refine their strategies.
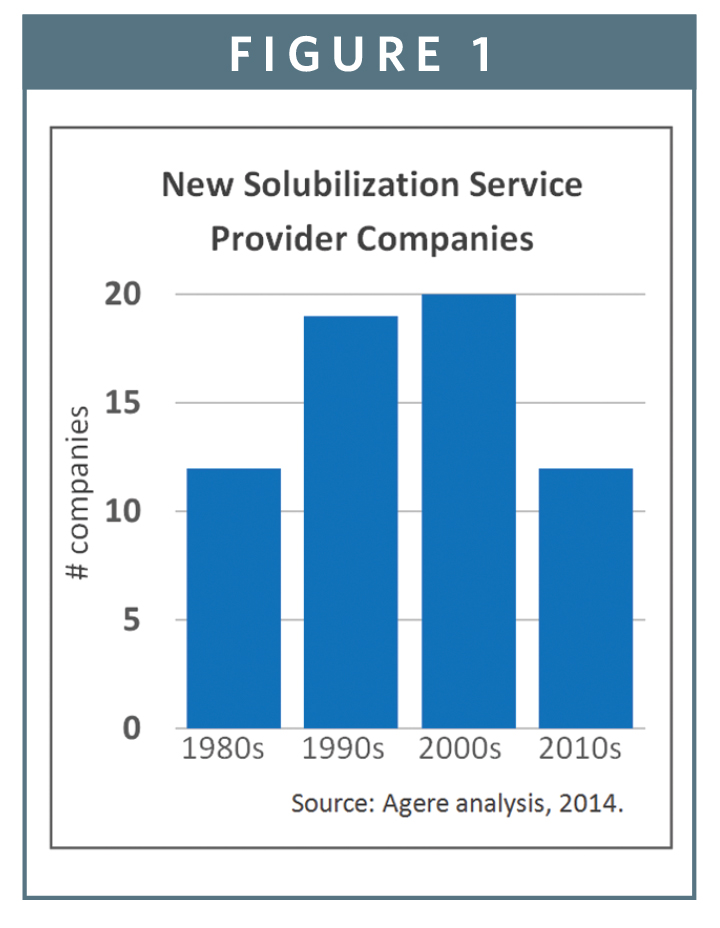
A recent Agere analysis of dynamics experienced by this outsourcing sub-segment corroborates these expectations. Our study shows that since 1980, the industry has added nearly 70 new entrants into the solubilization services market space, with nearly 50% of those occurring since 2000, and 20% forming over the last 5 years6 (Figure 1).
CHANGES & TRENDS IN THE SOLUBILIZATION SERVICES SPACE
Approved solubilized drugs over the last thirty-five years are evidence that there is a growing adoption of diverse solubilization technologies7. A historic analysis of marketed drugs can be used to predict trends in the acceptance and utilization of these different platforms. Another approach is to analyze the changes in the business environment of service providers that support solubilization projects.
In our effort to gain additional insights into shifts underway today, Agere conducted an analysis of the service providers offering solubilization solutions from formulation development through commercial manufacturing since the 1970s. Our study looked at market entry, market exit and consolidations of companies offering services in the following platforms: lipid/softgels, microparticles, nanoparticles, solid dispersions, and other miscellaneous technologies. This analysis utilized publically available information to compile all known companies involved in research, development and manufacturing in support of solubilization of 3rd party molecules as a service.8
OVERALL GROWTH IN NUMBER OF SOLUBILIZATION SERVICE PROVIDERS
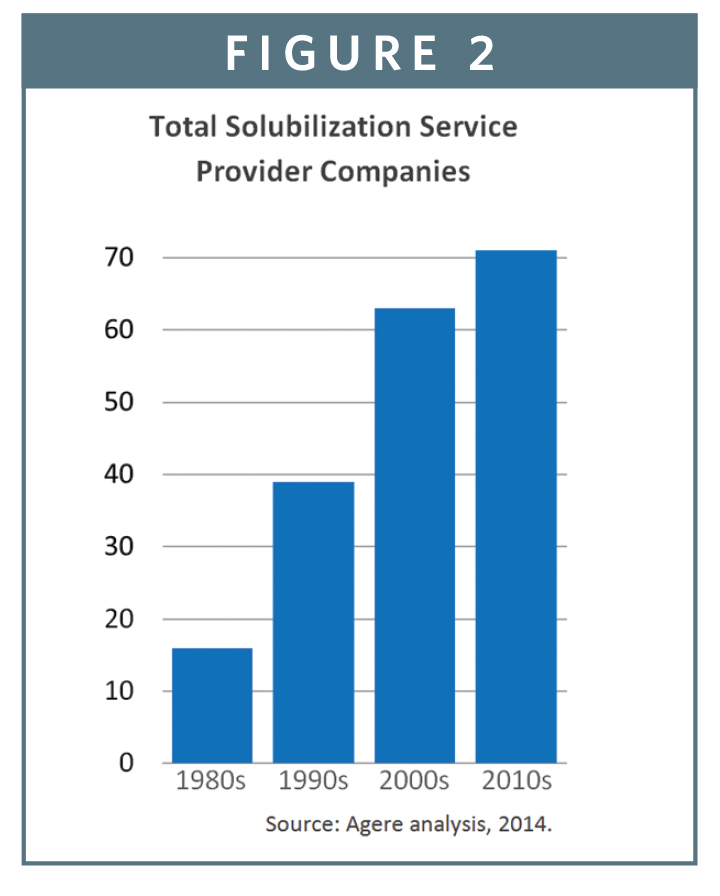
There has been a significant increase in the number of companies offering services to meet the solubilization needs of pharmaceutical and biotechnology companies over the last 35 years. A summary of some of our findings are presented in Figure 2. While a few companies such as RP Scherer were started many decades ago (1933), the majority of players emerged after the 1970s. In fact, between 1980 and today, the number of service providers in this market sub-segment has grown nearly 10 fold. This growth is striking when taking into account the consolidation resulting from 40 acquisitions and mergers during this same period. These activities both aggregated companies and also took some companies captive, removing them from our count of specialized service providers.
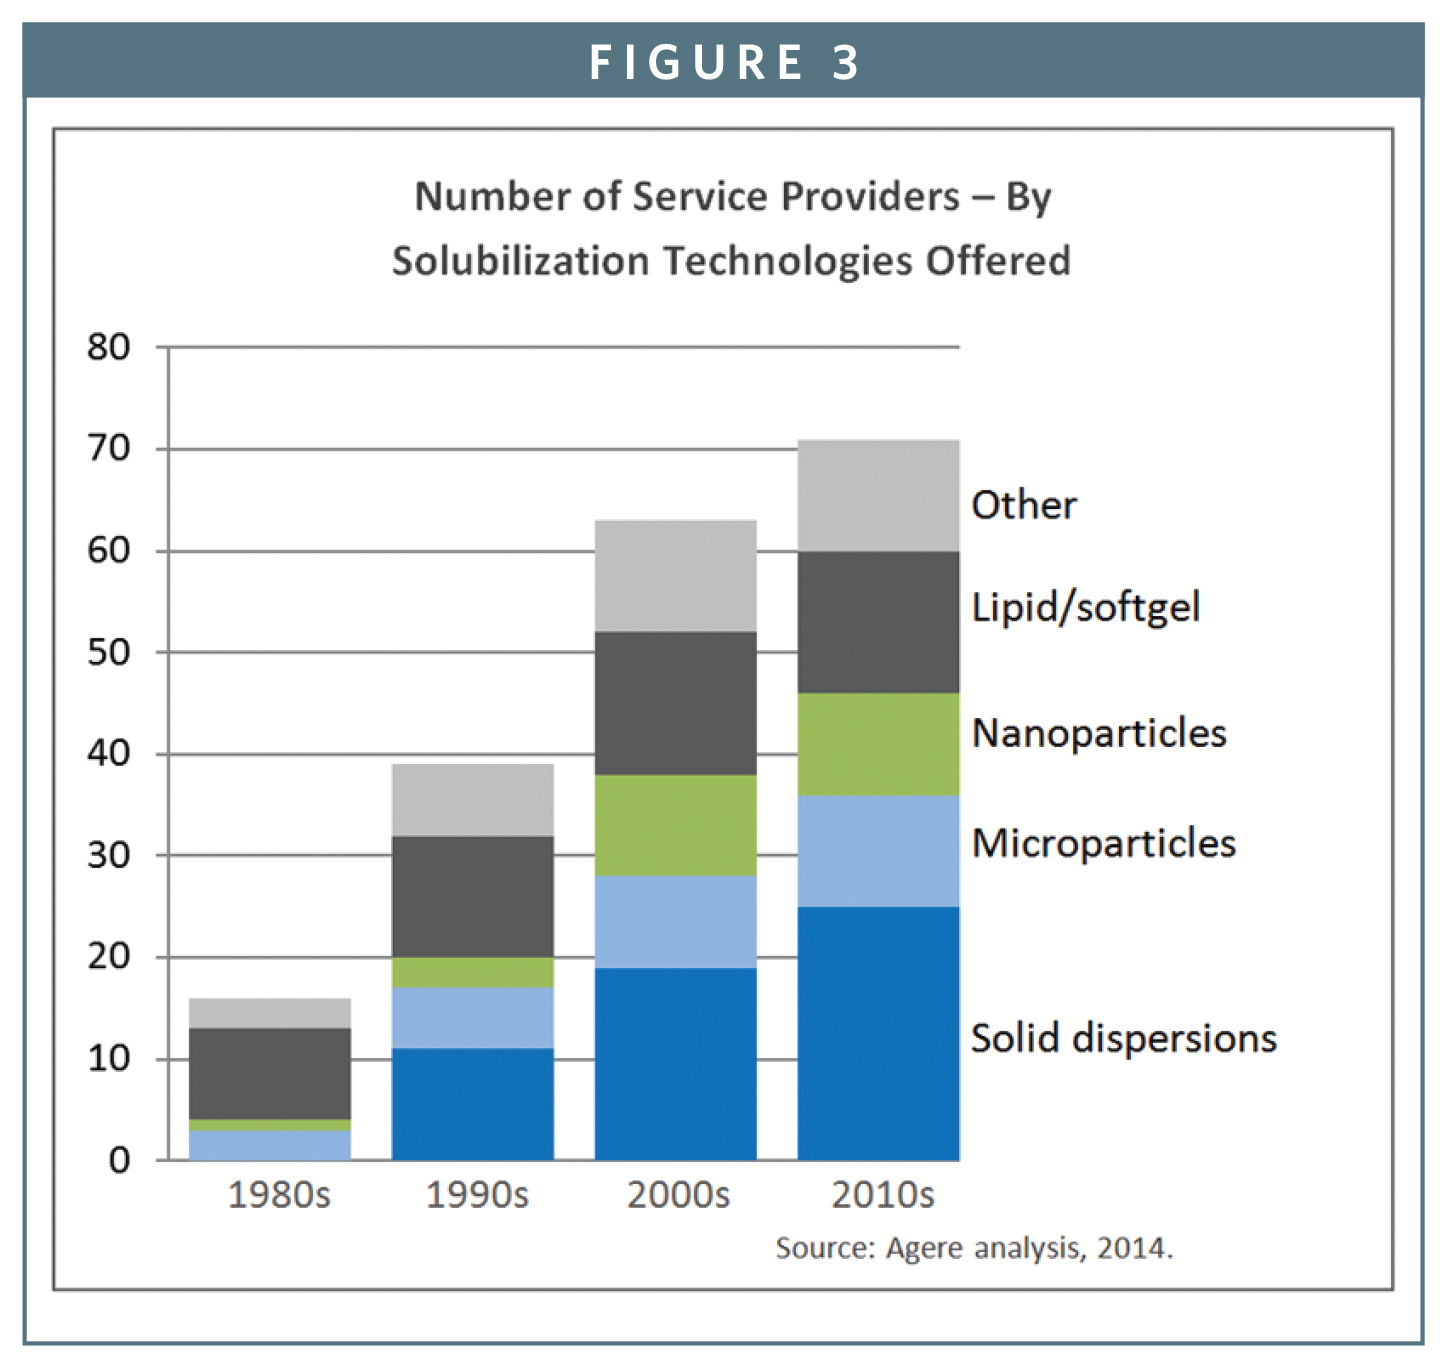
When looking at the number of companies offering services by solubilization platform, we see trends that correlate with the findings from our prior studies on marketed drugs and literature citations. Not surprisingly, softgel providers dominated in the two earliest decades in our analysis, and the number of companies has stayed relatively constant in this market segment. Starting in the first decade of this century, however, the number of service providers in the solid dispersion sub-segment exceeded that of lipid/softgel providers. And service providers utilizing solid dispersion platforms continues to grow in number, with 25 players in the market as of today, approaching twice as many as offering lipid-based solutions (Figure 3).
 IT’S NOT JUST THE NUMBERS
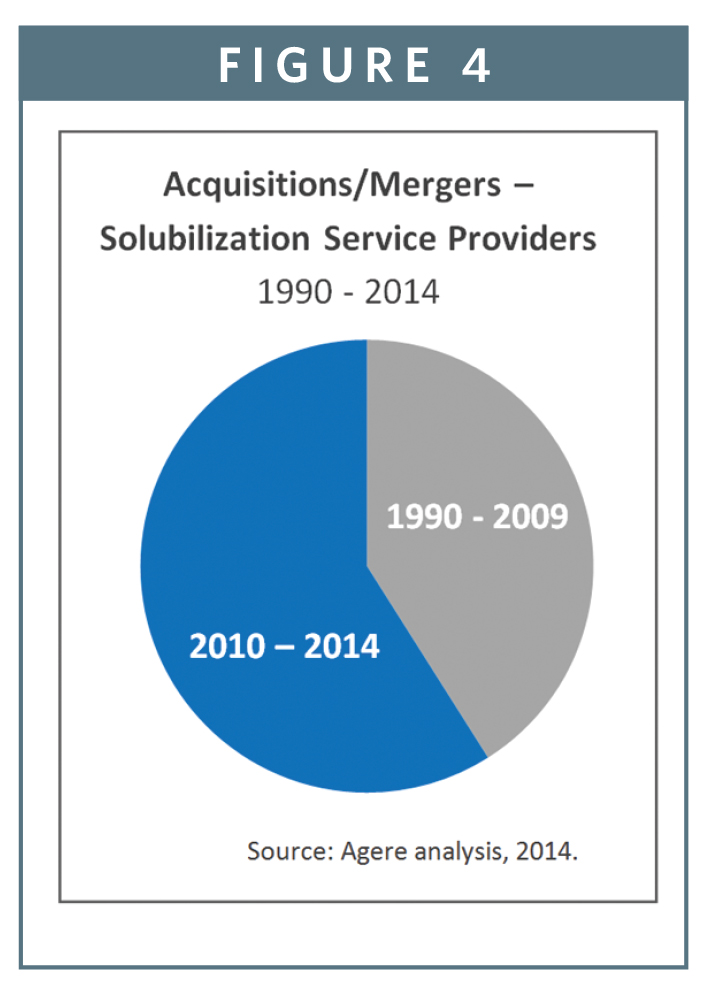
In addition to new entrants, also characteristic of a market experiencing rapid growth is consolidation. While the number of players is represented in these growth charts, it’s well understood that the number of new players doesn’t convey market dominance, and that there’s a natural evolution toward consolidation for a variety of reasons. These include the alignment of smaller companies with other players to benefit from economies of scale, or larger companies that “innovate through acquisition” as a strategy to provide more comprehensive services to their customers. This sorting out of the market is accelerating, with nearly 60% of all acquisitions of solubilization service providers since 1990 having occurred in the last 5 years9 (Figure 4), and in some cases, companies have changed hands as many as 3 times over this same period.
As consolidation is a common route to growth for large companies, not surprisingly the largest CMOs in the solubilization space also have multiple platform offerings as a result of acquiring smaller, more specialized companies. Additionally, and with few exceptions, it is the large organizations that clearly dominate the market share for the delivery platforms examined. This work also shows that companies that are among the first to enter a particular market segment end up with the largest market share10. This trend is true for softgel, micronization, nanoparticles and solid dispersions. This finding is particularly interesting since even a short study of innovation diffusion shows that those with first-mover advantage often fail to capitalize on having been earliest to market, being displaced by more aggressive competitors even with lesser technology, or by providers offering a superior technical or economic solution. Yet our analysis doesn’t surface instances of note or supporting evidence of these vulnerabilities.
Admittedly, the absolute number of companies and consolidations in the solubilization services space pale by comparison with the number of pharmaceutical companies and their mergers and acquisitions. However, given the preponderance of insoluble molecules in development today, our industry segment is becoming more broadly relevant. This is truly an exciting time, as this is the type of environment fosters innovation, as familiar and validated technologies are more broadly applied, and new technologies and technological combinations emerge.
LOOKING FORWARD
Taking a snapshot of the solubilization sub-segment of the outsourcing market today reveals another interesting aspect relating to progress and growth potential. Today 35% of companies offer solid dispersion technology solutions, a greater percentage than those offering lipid/softgel solutions, once dominant at 60%. Of course, the largest players all offer this technology option, so this decrease in percentage reflects both consolidation and the emergence of additional popular solutions. The category of service providers not yet large enough to be categorized in the top four platforms, “Other” (Figure 3), has nearly quadrupled since the 1980s. The growth in this subcategory could reflect new and diverse approaches to tackling solubilization, and may possibly hold the seeds of an emerging technology that could move the industry even further forward and become the next dominant solution.
To view this issue and all back issues online, please visit www.drug-dev.com.
REFERENCES
1.http://www.brookings.edu/~/media/research/files/papers/2014/06/entrepreneurship_job_creation_life_sciences_sector_litan/entrepreneurship_job_creation_life_sciences_sector_litan.pdf.
2. April 2014, http://www.drugdev.com/Main/Back-Issues/SPECIAL-FEATUREOutsourcing-Formulation-Developmen-677.aspx.
3. Agere analysis of drugs in development and historic percentage of all drugs achieving FDA approval in 2013, and range of estimated insoluble drugs at between 70% and 90%.
4. http://www.slideshare.net/jlagref/competitive-strategy-in-fragmentedbusiness.
5. Michael E. Porter, Competitive Strategy. http://www.iseg.utl.pt/aula/cad1505/Textos_Apoio/cap_9_a_13_Michael_Porter.pdf.
6. Agere analysis; only new companies formed are counted; acquisitions and renaming of existing entities excluded.
7. https://drug-dev.com/Main/Back-Issues/BIOAVAILABILITY-ENHANCEMENTAnalysis-of-the-Histor-657.aspx.
8. The analysis did not make a distinction between size of company, and companies regardless of the service or services provided – research, development, clinical trial materials manufacturing or commercial manufacturing – are weighed equally, and only accounted for once.
9. Agere analysis December 2014.
10. This includes companies that were dominant, even if now an acquired part of a larger CDMO.

Marshall Crew, President & CEO, Agere Pharmaceuticals, Inc.
crew@agerepharma.com
https://www.linkedin.com/profile/view?id=17815140
Total Page Views: 2351